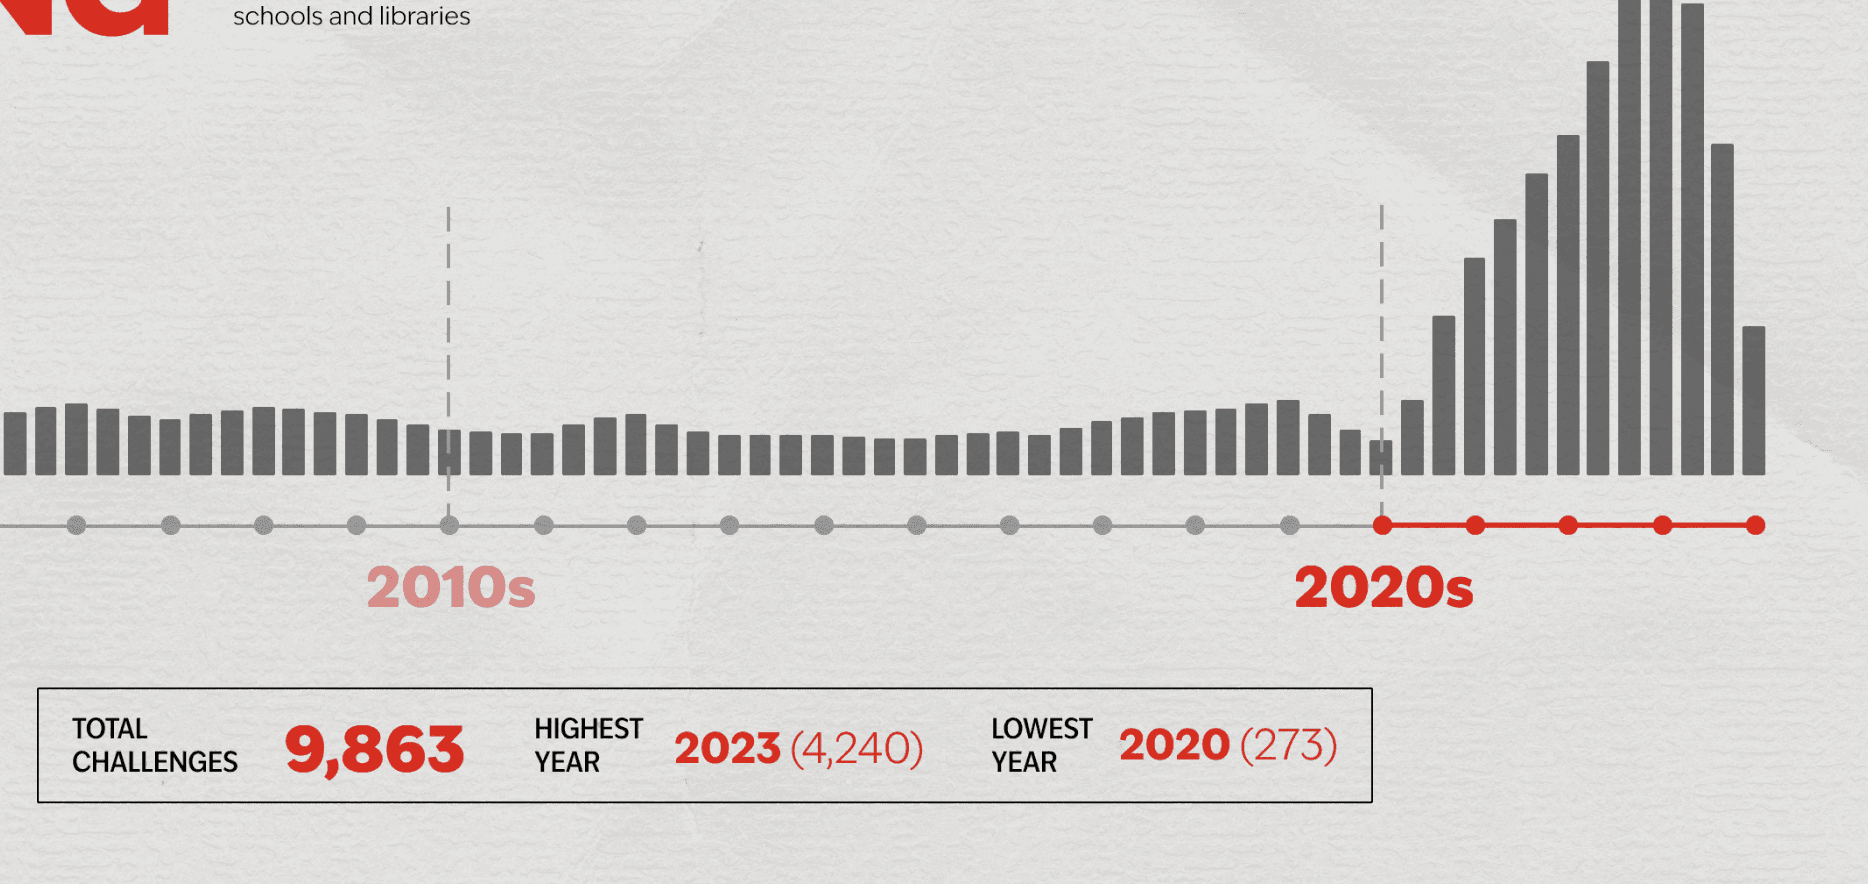

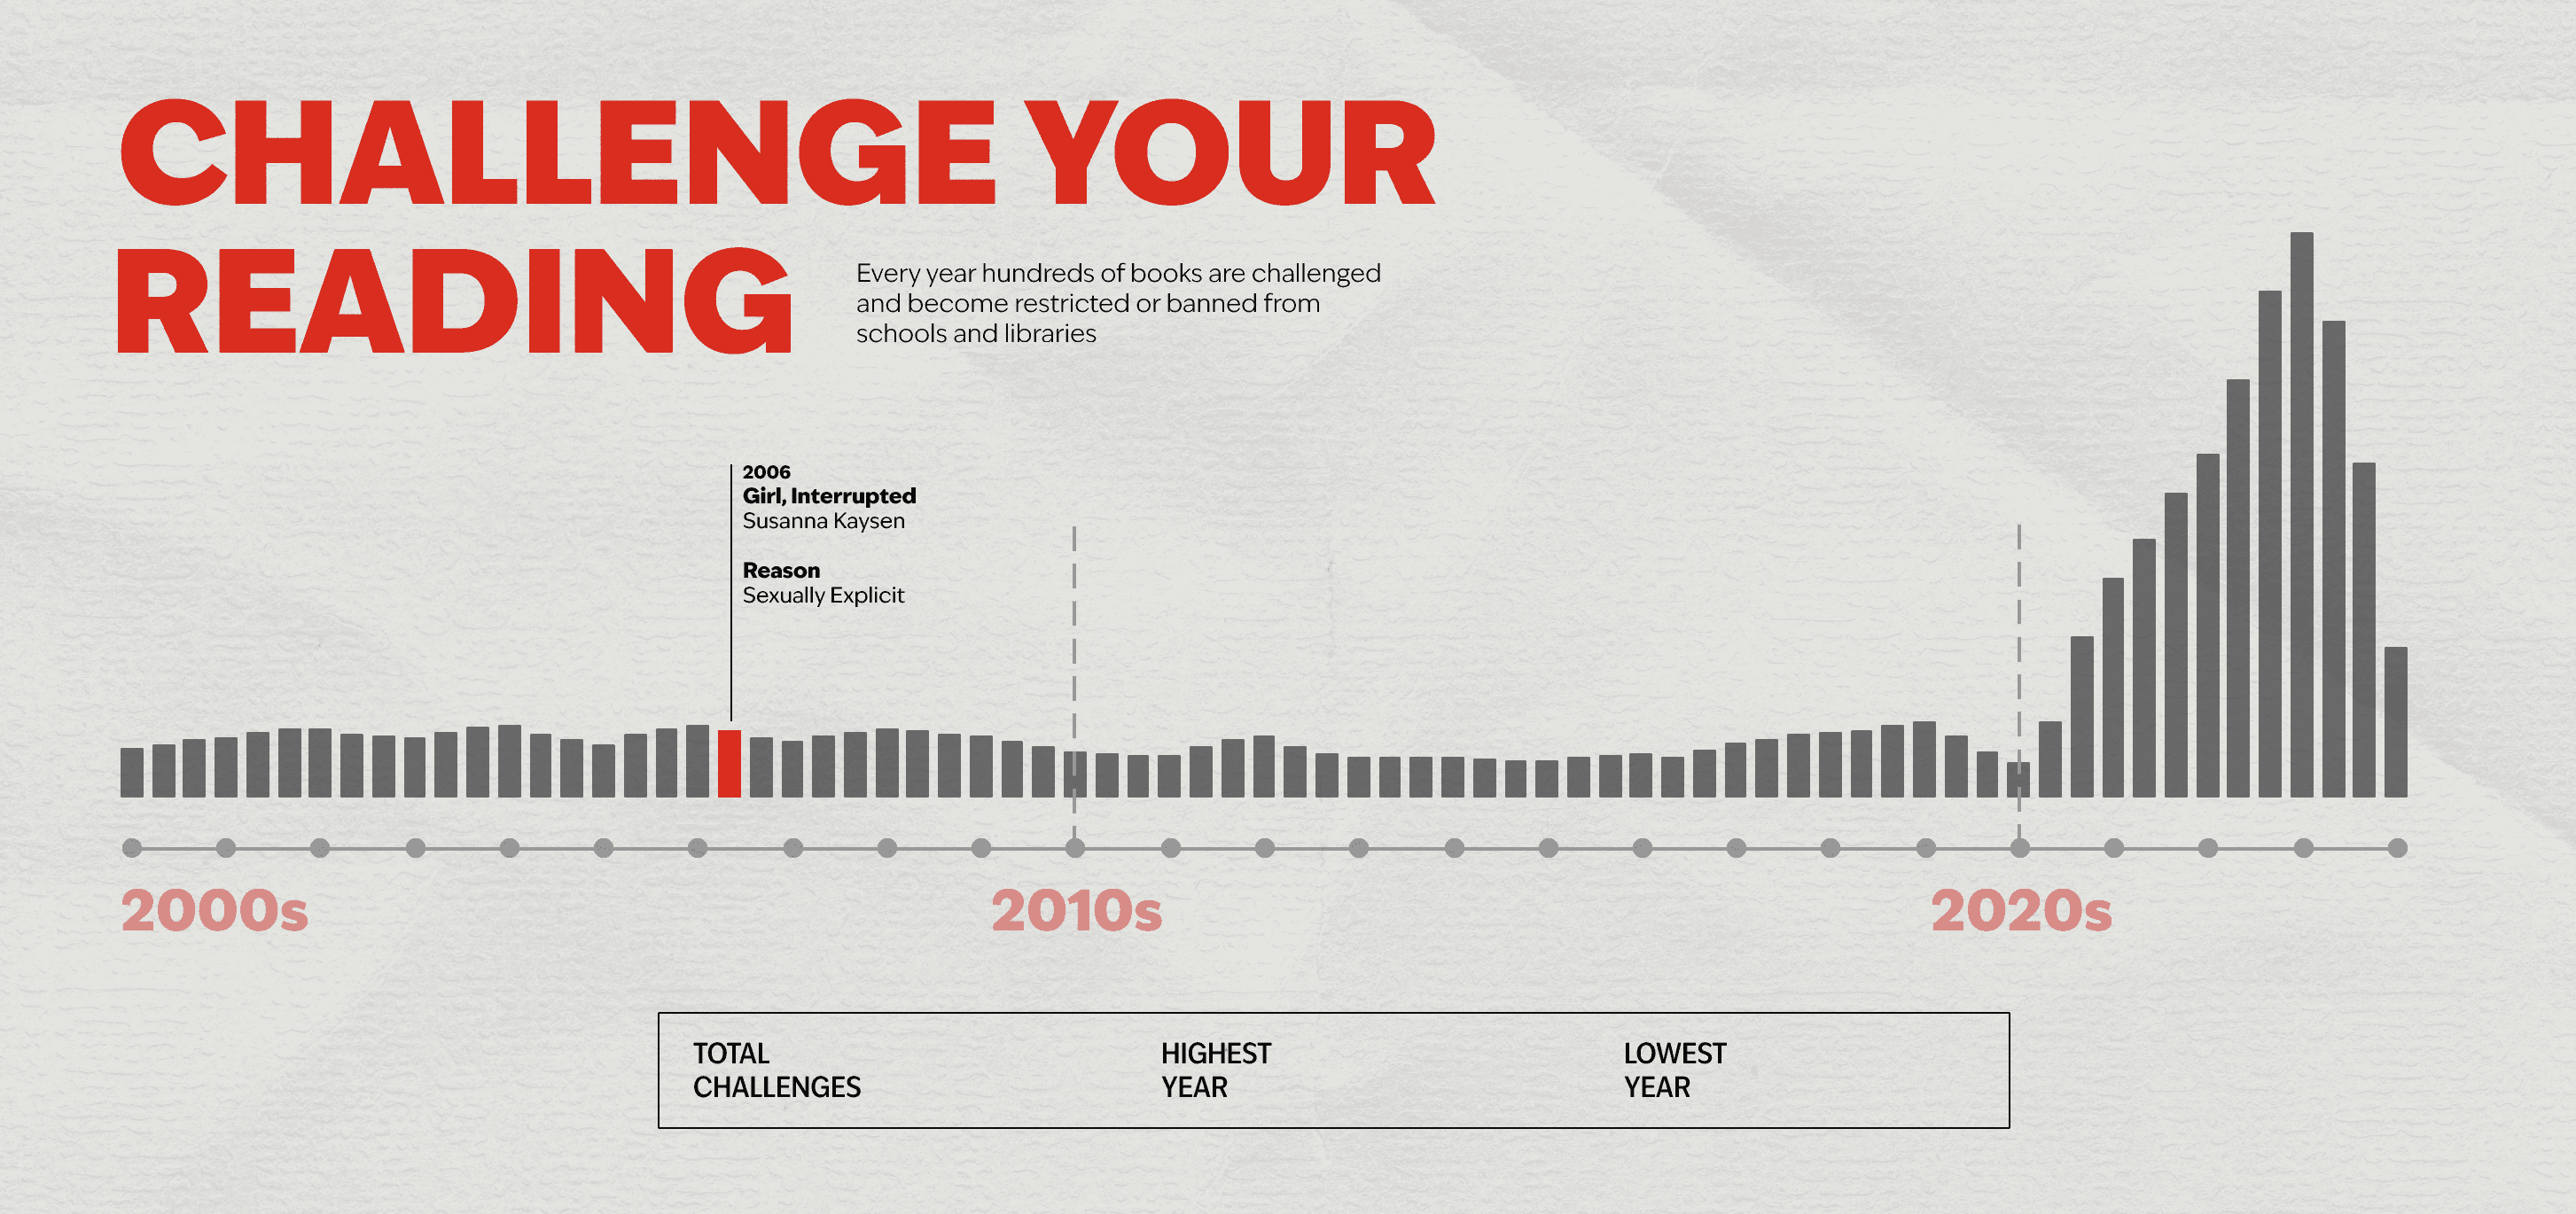
This graph is not only a visual aid on the progression and regression of banned book throughout the years, but as a tool for bringing awareness on censorship and the importance of free access to information.
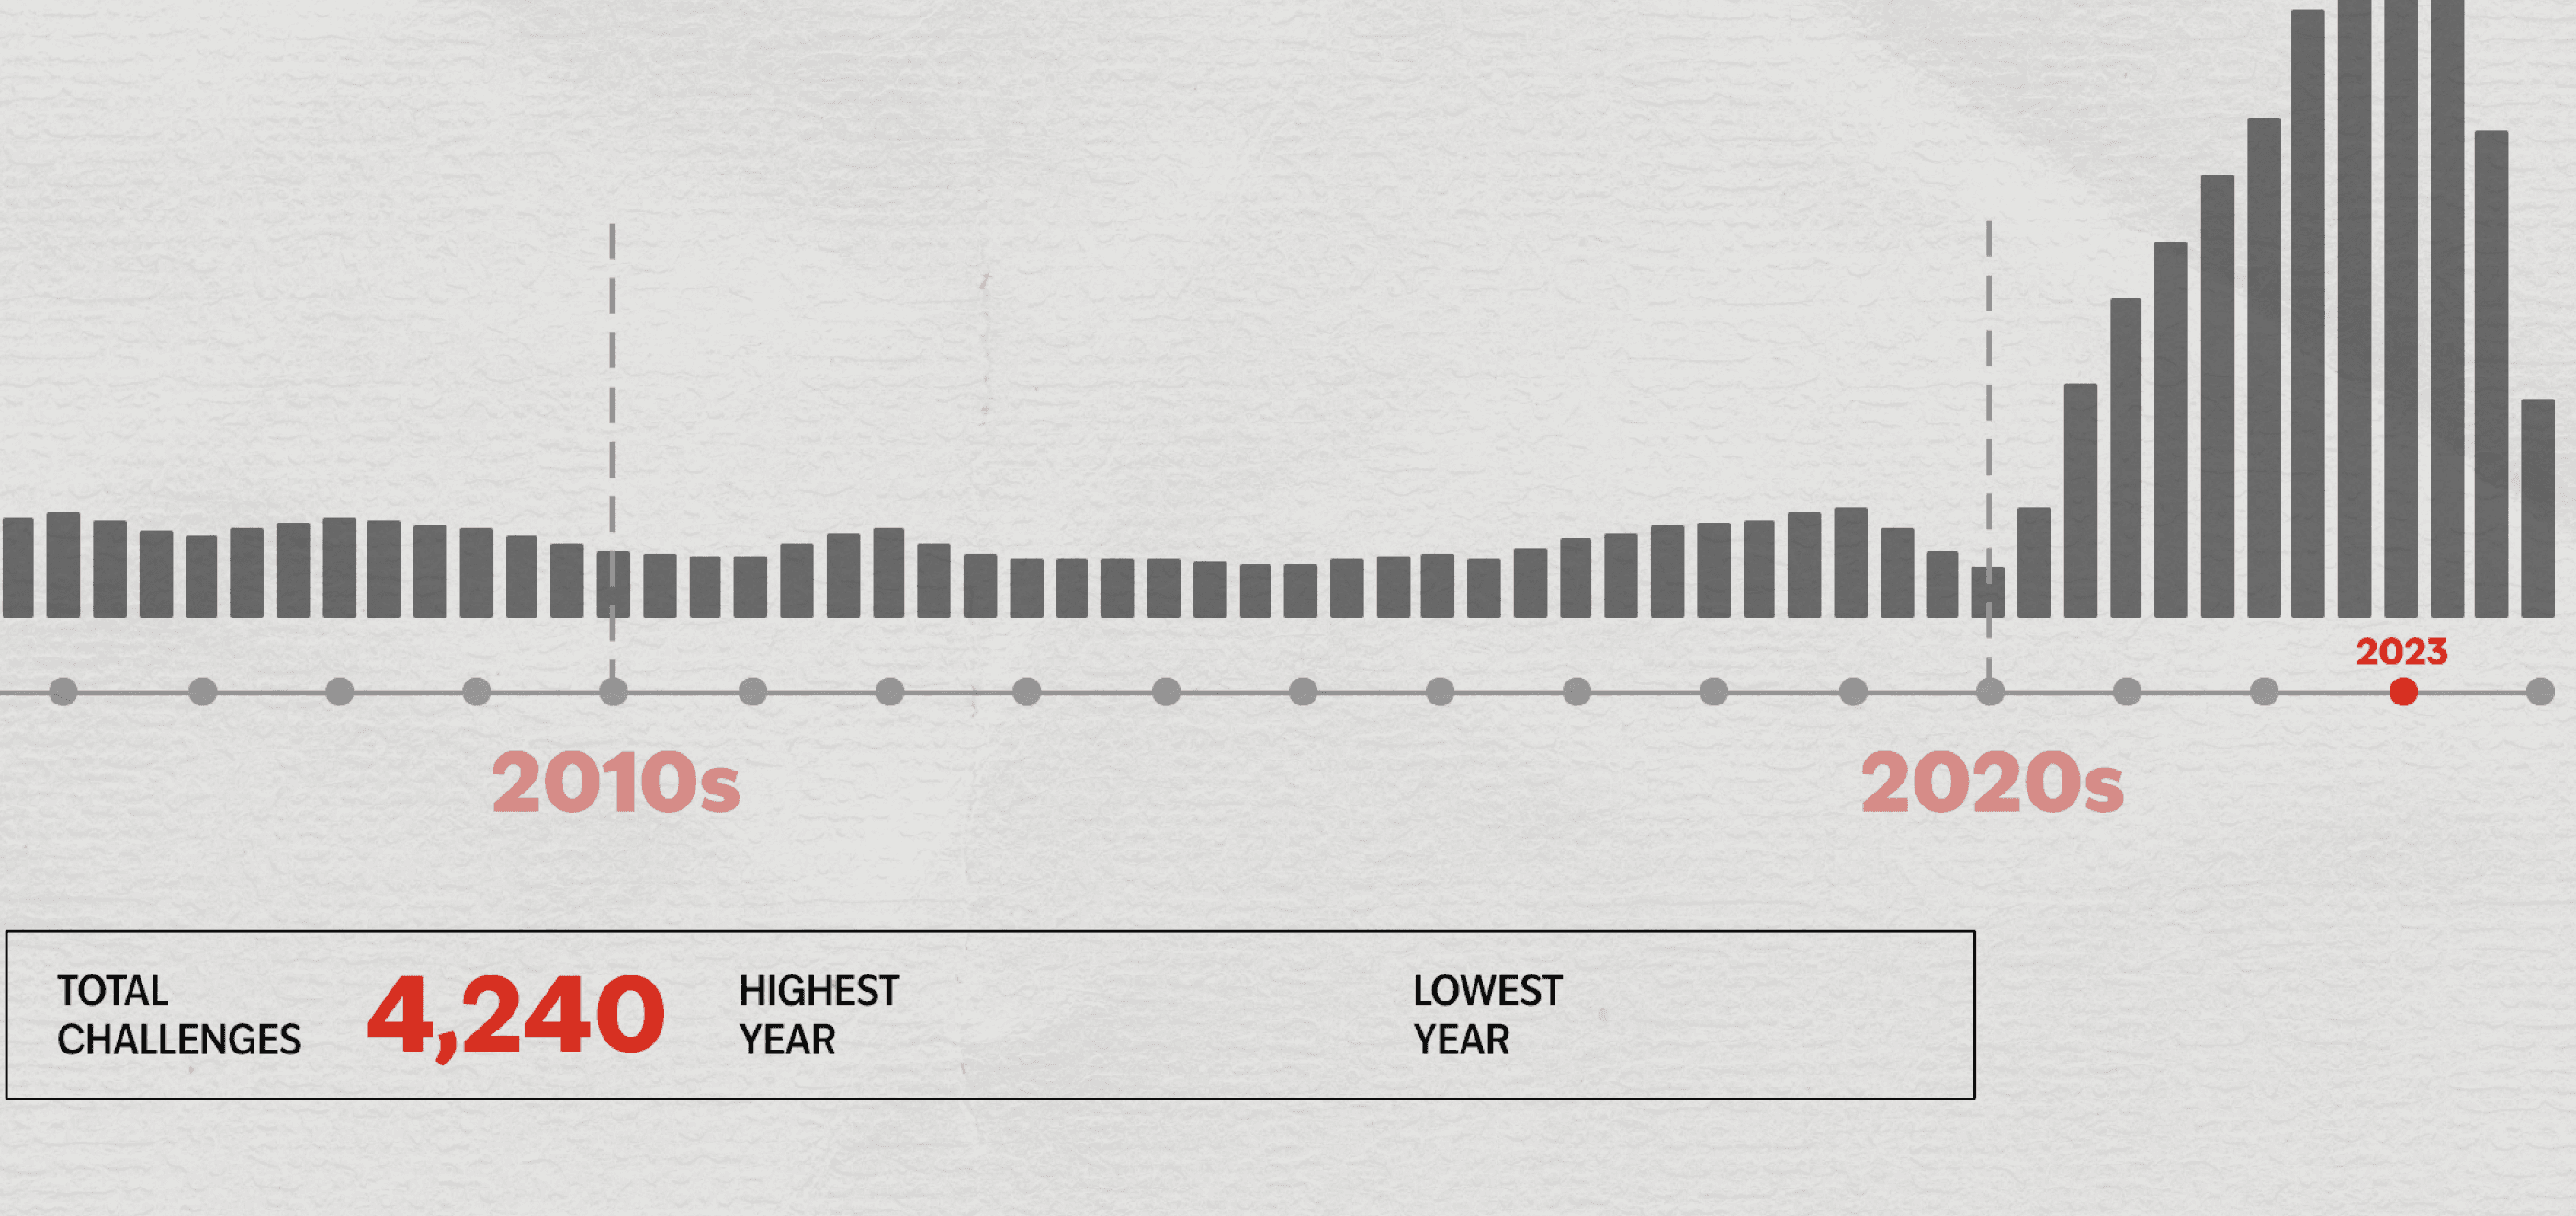
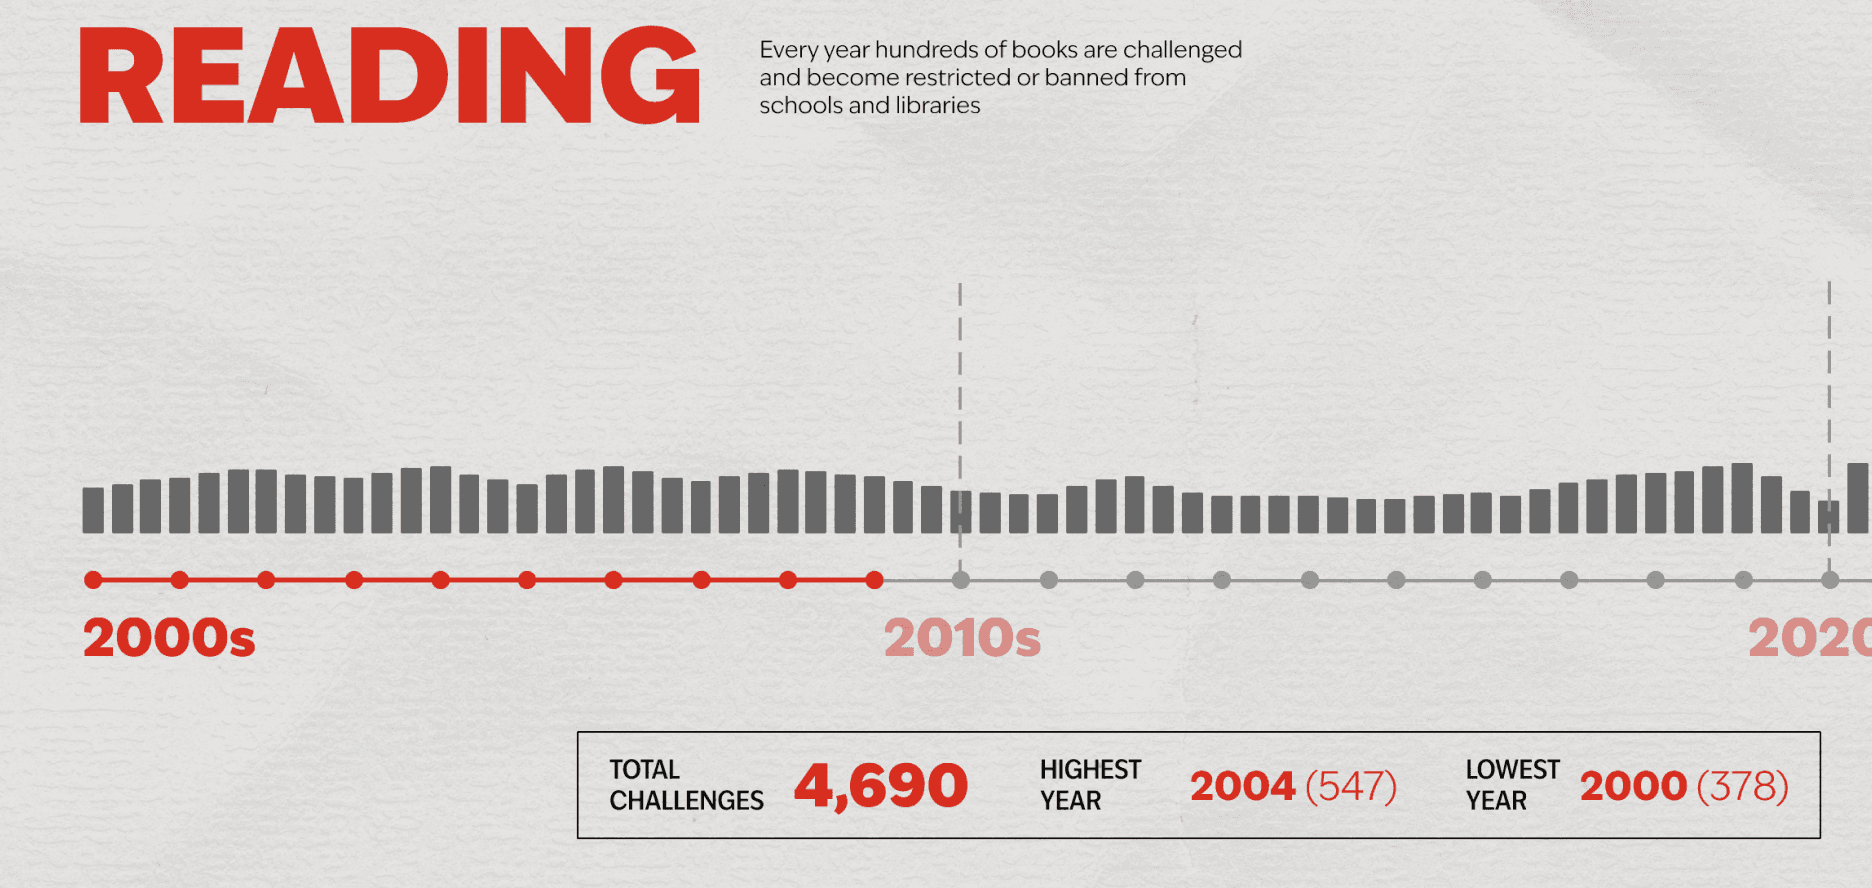
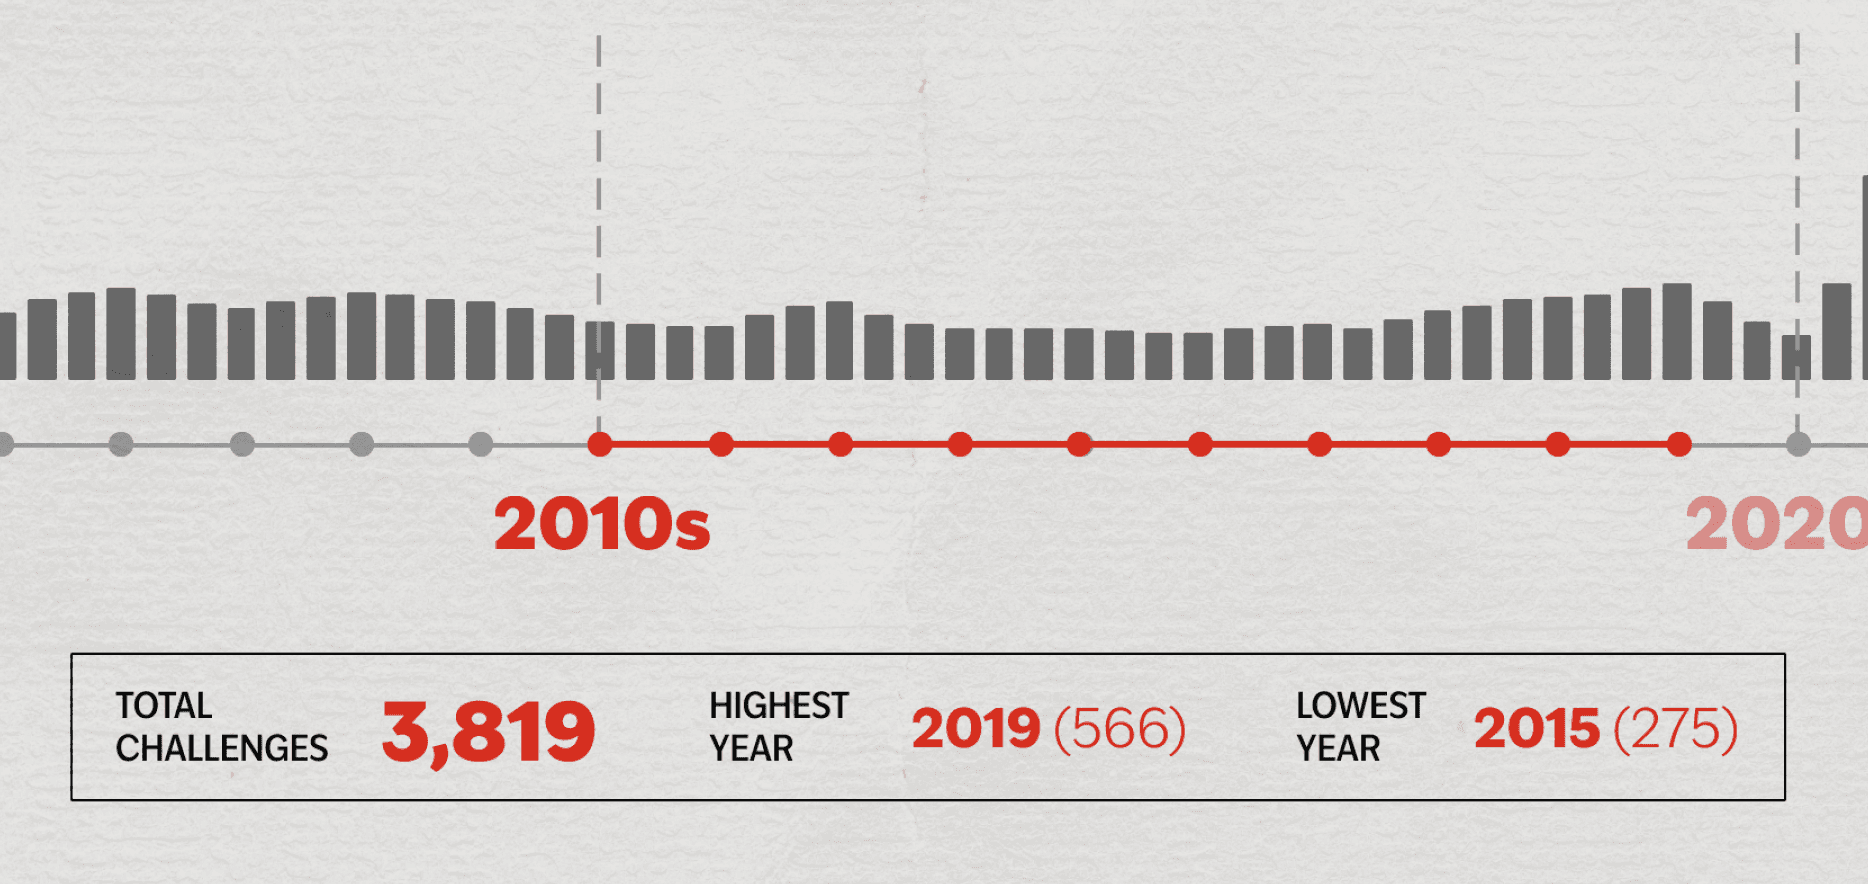
The dash lines help visually separate the decades and allow users to see the total amount of banned books within that decade while showing the highest and lowest numbered year.
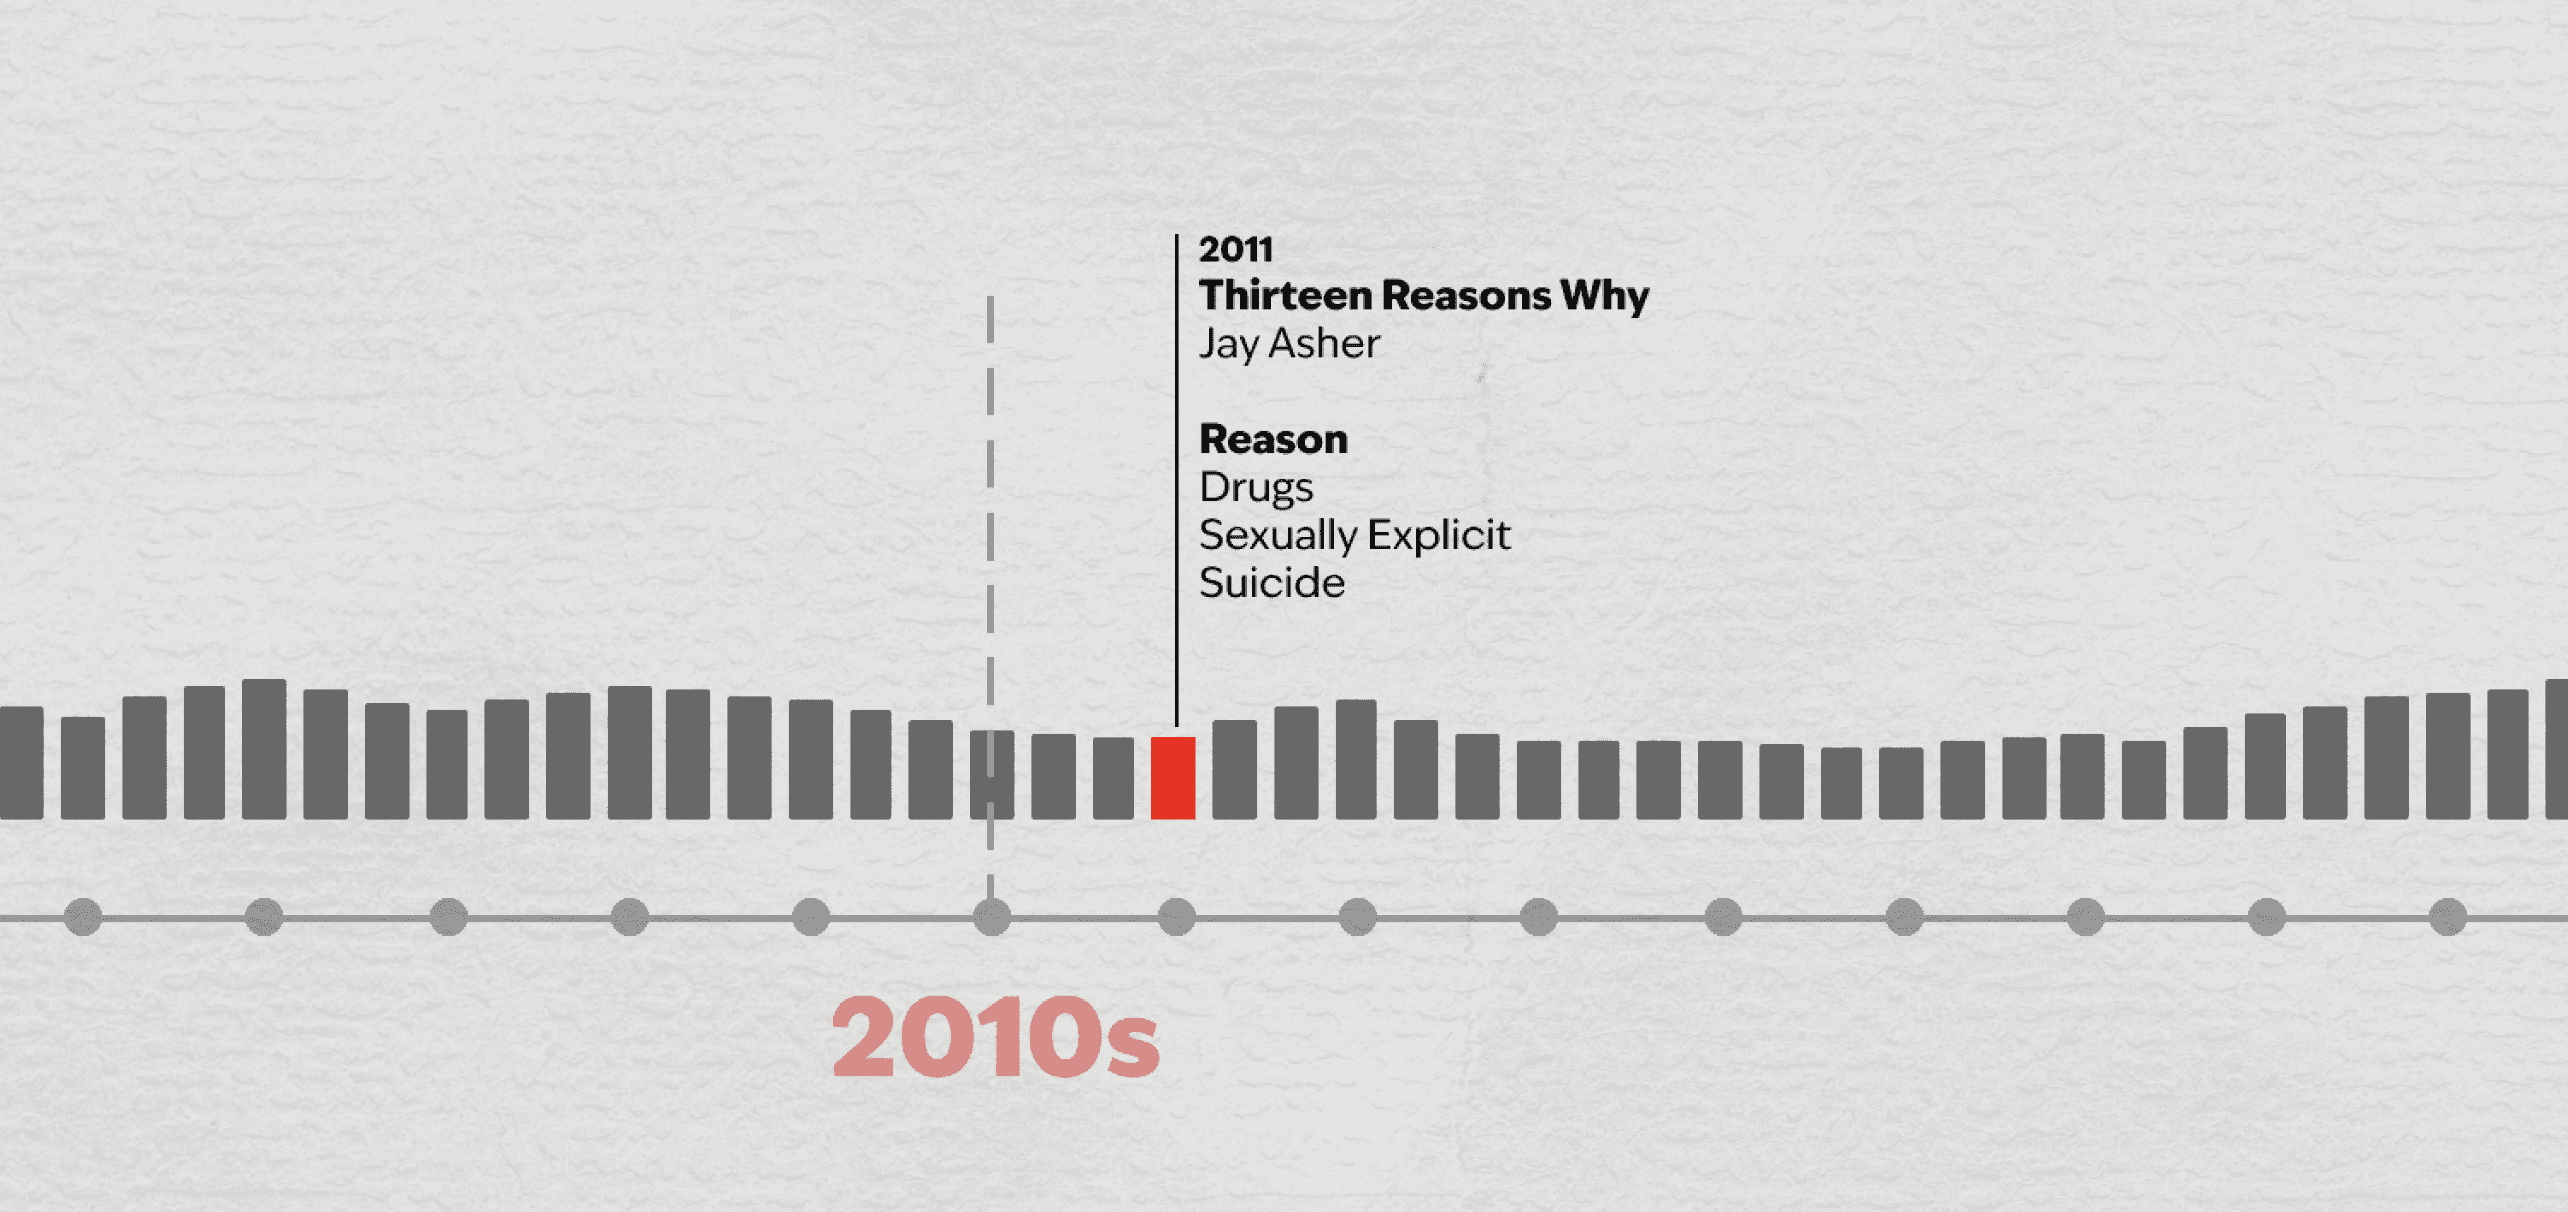
The dotted line under the bar gives a more in depth look into each year by the total challenges of that year.
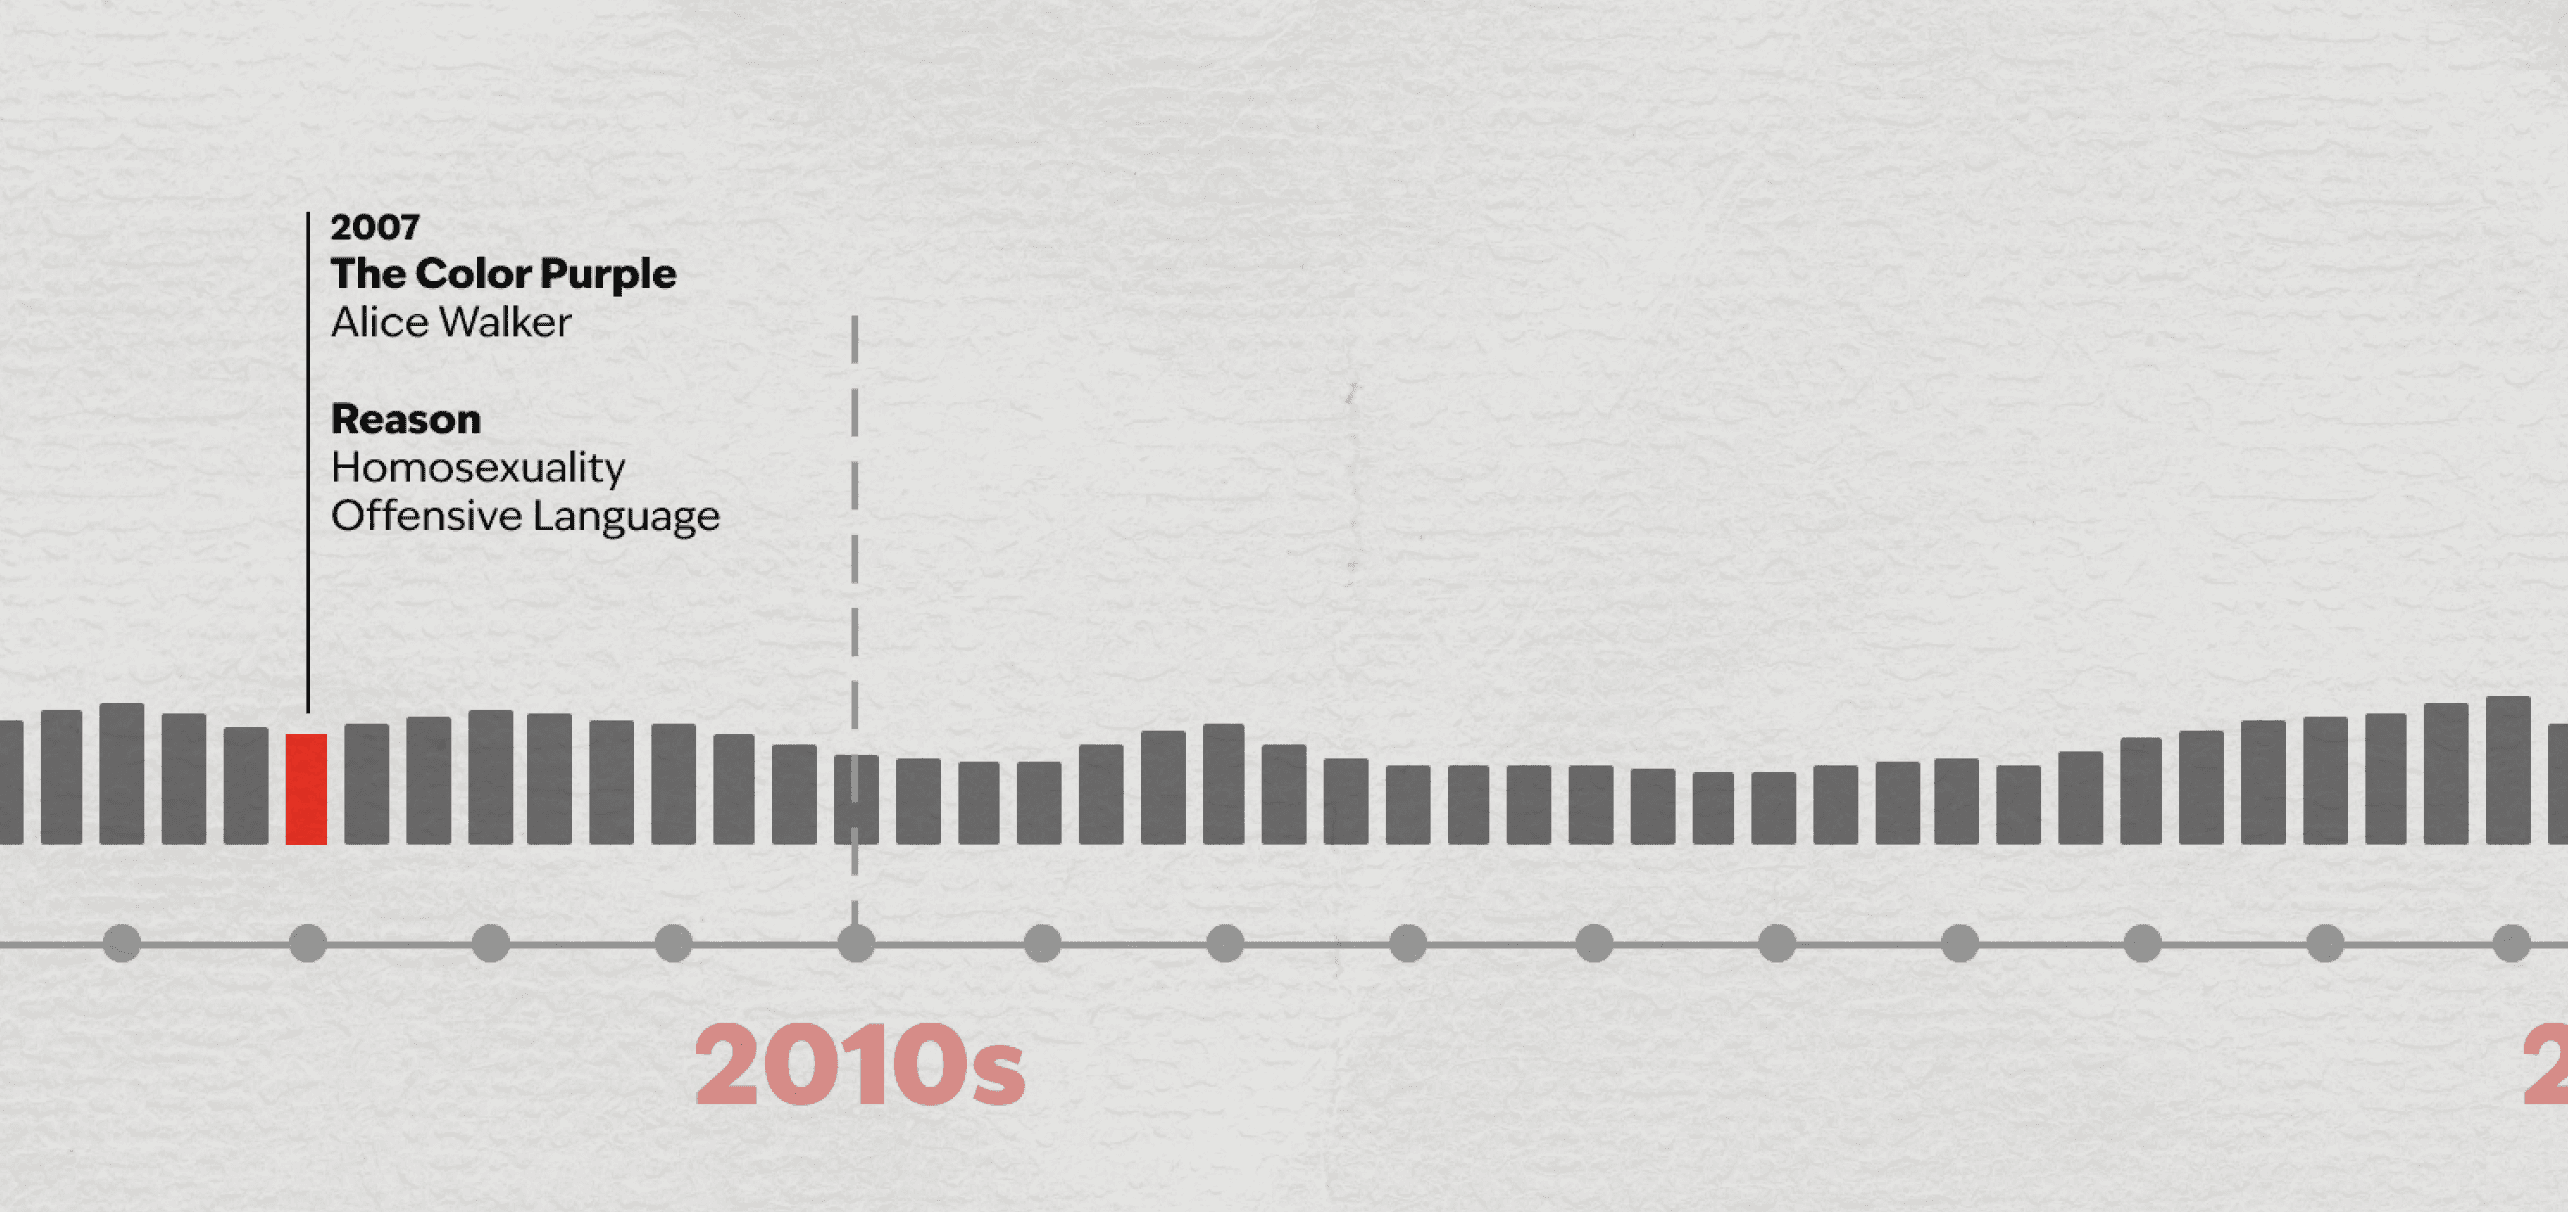
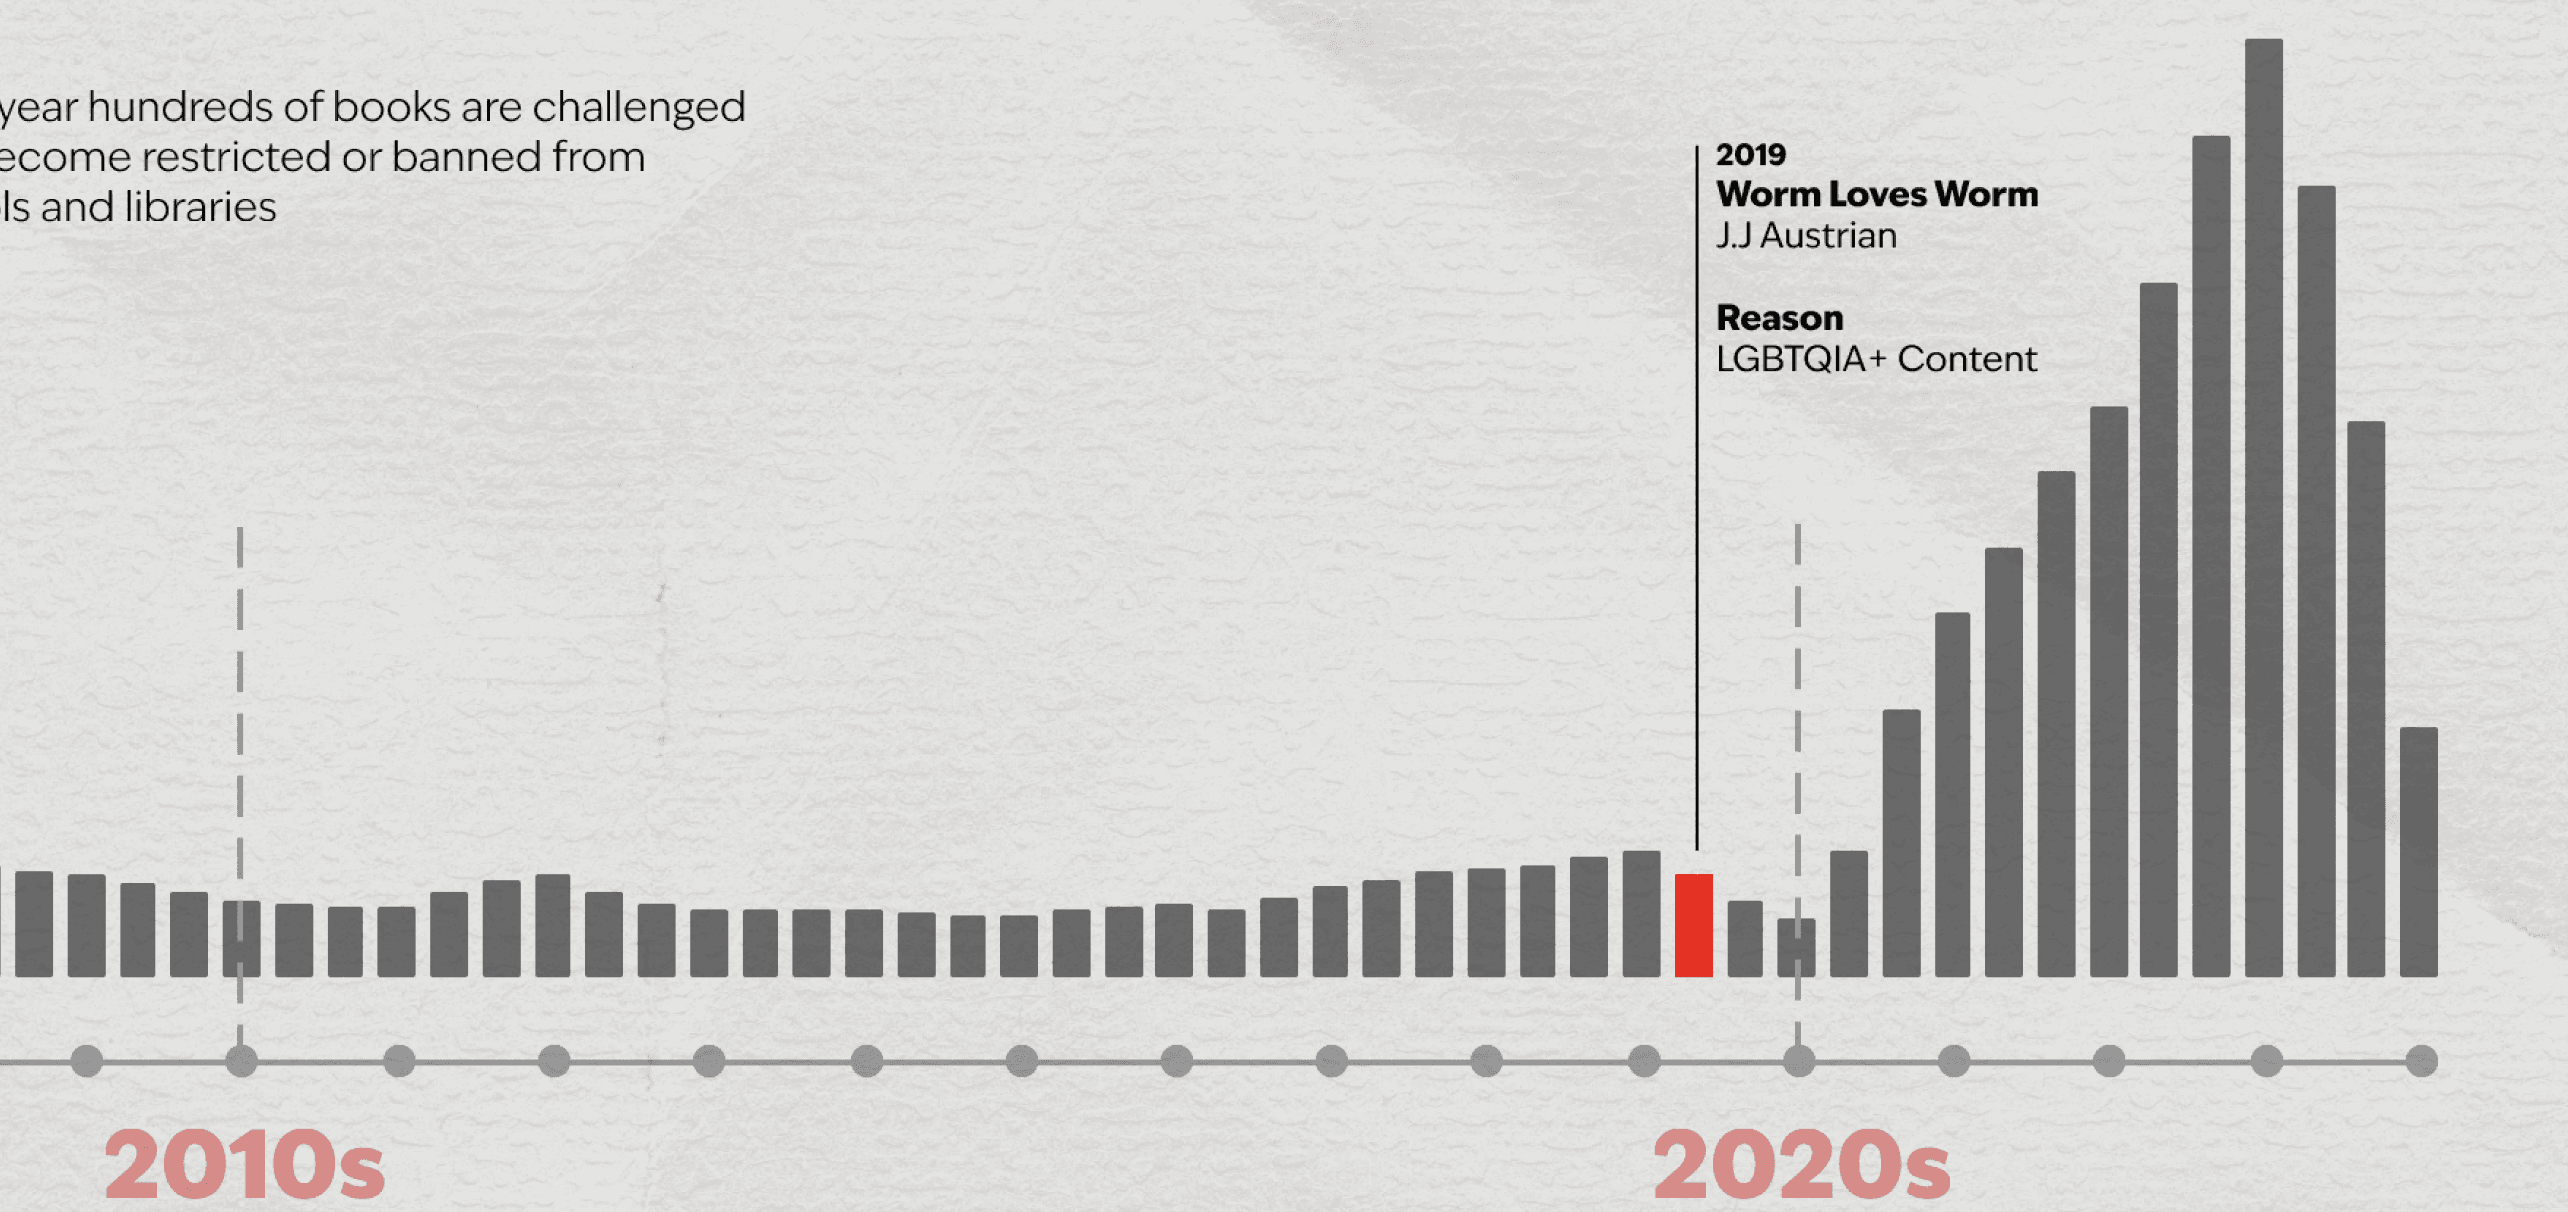
The selection of examples were all intentionally chosen as they are meant to spotlight books published by BIPOC authors along with important topics such as human rights, mental health, and LGBTQIA+ inclusivity.
Every bar from the graph displays a banned in that year along with the reasons as to why it was challenged.
By simplifying and condensing extensive data (collected from the American Library Association) into an engaging and interactive screen, the information is now easier to understand for the general public.
Challenge Your Reading is an interactive map that displays data on banned books in the United States throughout the years.
Challenge Your Reading
DATA COLLECTION
INFORMATION DESIGN
PROTOTYPING
FOCUS
TIMELIME
4 WEEKS
SOFTWARE
FIGMA
ILLUSTRATOR
INTERACTIVE
Book Details
By Year
By Decade

Next Project: Revive